
COST chart
Costco runs membership warehouse stores that sell groceries and household goods in bulk at low prices. Most of its profit comes from the annual membership fees.
Dividends · Quarterly
| Ex-dividend | Paid | Amount |
|---|---|---|
| Oct 30, 2026 | Nov 13, 2026 | $1.47 |
| Jul 24, 2026 | Aug 7, 2026 | $1.47 |
| May 1, 2026 | May 15, 2026 | $1.47 |
| Jan 30, 2026 | Feb 13, 2026 | $1.3 |
News
News for this market is coming.
1,008.85−0.44%
Vol $30.8KBid —Ask —
Key facts
- Venue
- Hyperliquid XYZ
- Contract
- Perpetual · USDC
- Trading hours
- 24/7
- Tick size
- 0.01
- Max leverage
- 20×
- Funding
- 0.000625%/h
- Open interest
- $405K
Company
- Name
- Costco Wholesale Corporation
- Exchange
- NASDAQ
- Type
- Common stock
- Industry
- —
- Headquarters
- —
- Employees
- —
- Listed
- —
- Shares outstanding
- —
- Options
- Listed
- Website
- —
- SEC filings
- EDGAR
Trading Console
Trade COST from its chart
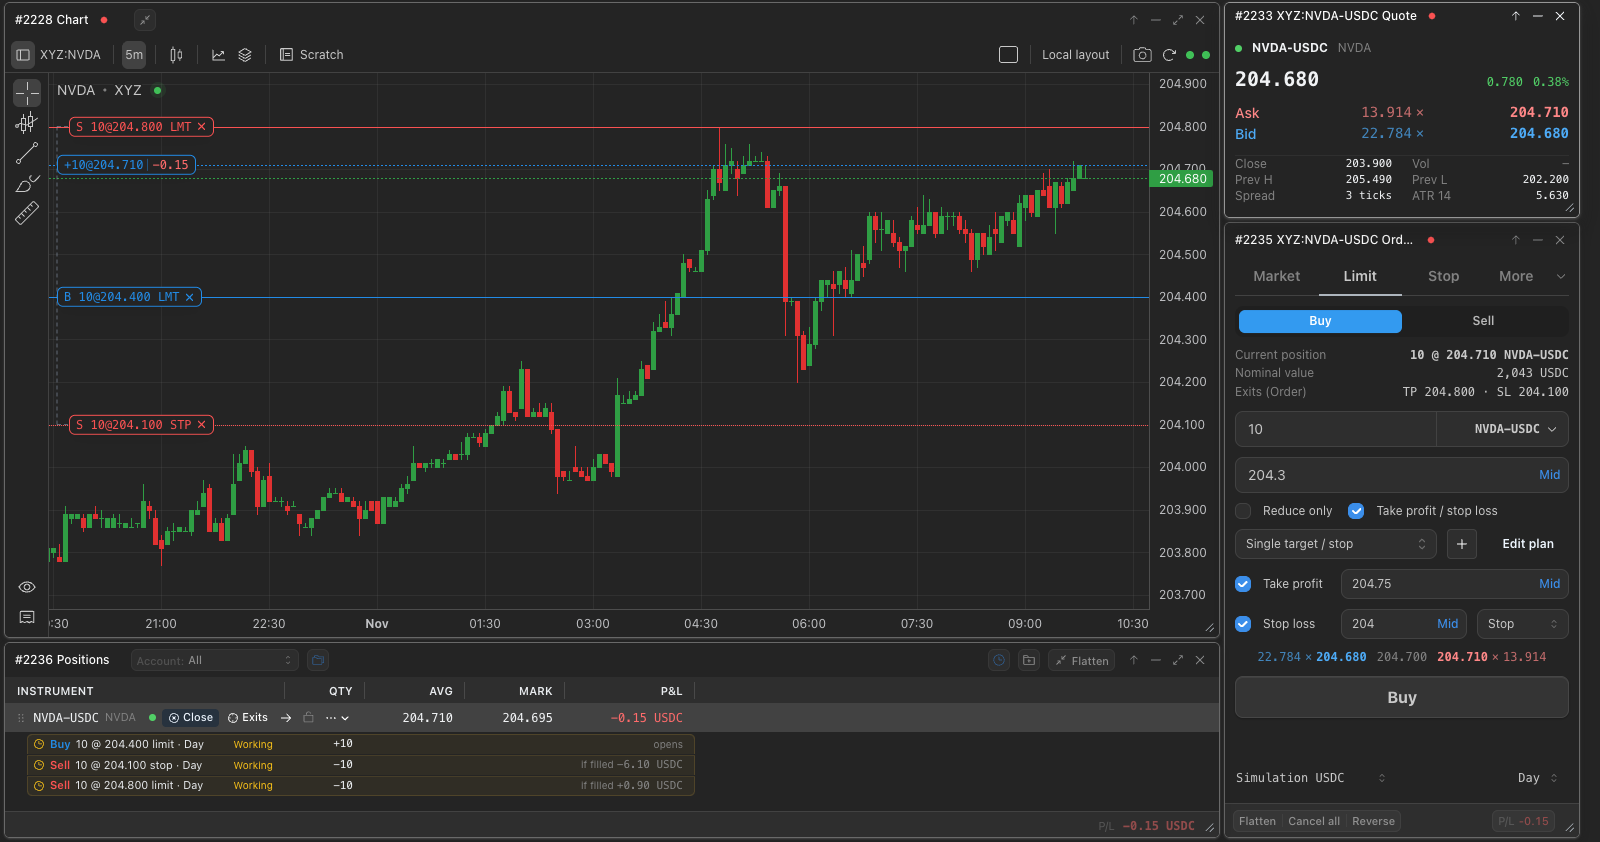
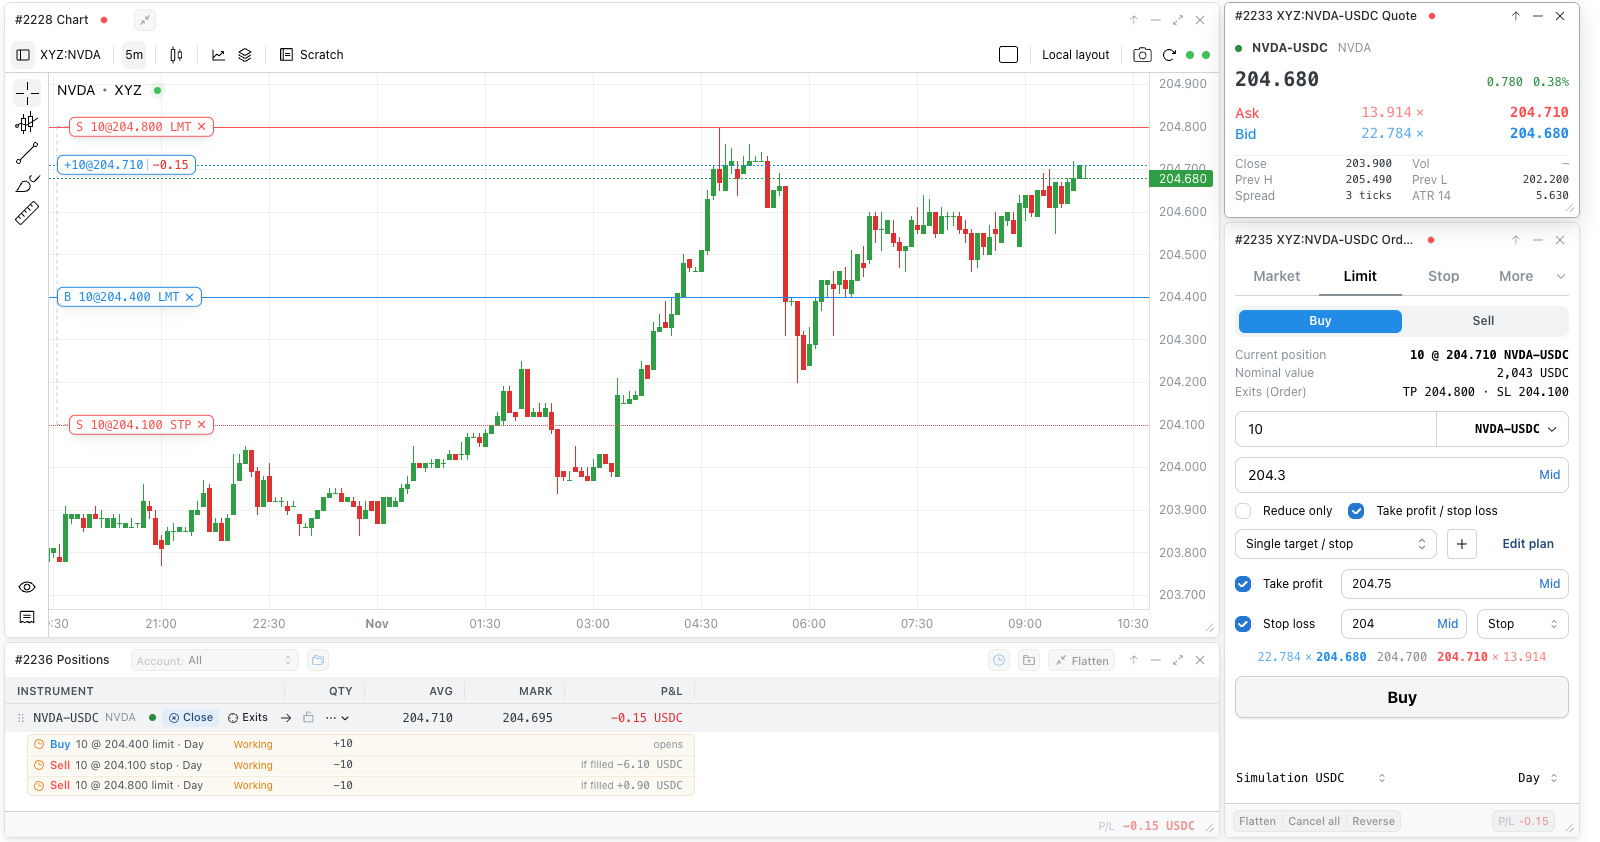
In Trading Console the chart also takes orders: a position, its take profit and stop loss, and working orders show on it as lines, with order entry beside it.